

Nordic Test System
The Nordic test system is a well-established benchmark for voltage stability and long-term dynamics studies, originally defined in the IEEE PES Technical Report on Test Systems for Voltage Stability Analysis and Security Assessment. It represents a realistic multi-area transmission network and is used extensively in research and education.
Watch it
Section titled “Watch it”Episode 10 of the video series, Capstone: Voltage Collapse on the Nordic System, covers this page.
System Overview
Section titled “System Overview”| Property | Value |
|---|---|
| Nominal frequency | 50 Hz |
| Buses | 74 |
| Synchronous generators | 20 (g1–g20) |
| Transformers | 50 (TRFO records, step-up and distribution) |
| Transmission lines | 52 |
| Voltage levels | 15 kV, 20 kV, 130 kV, 220 kV, 400 kV |
| Installed generation | 16,550 MVA (11,500 MW dispatched at operating point A) |
The system is divided into several areas interconnected through a meshed 400 kV transmission network. Lower voltage levels (130 kV, 220 kV) serve sub-transmission, while 15 kV and 20 kV buses connect generators and distribution loads.
One-line Diagram
Section titled “One-line Diagram”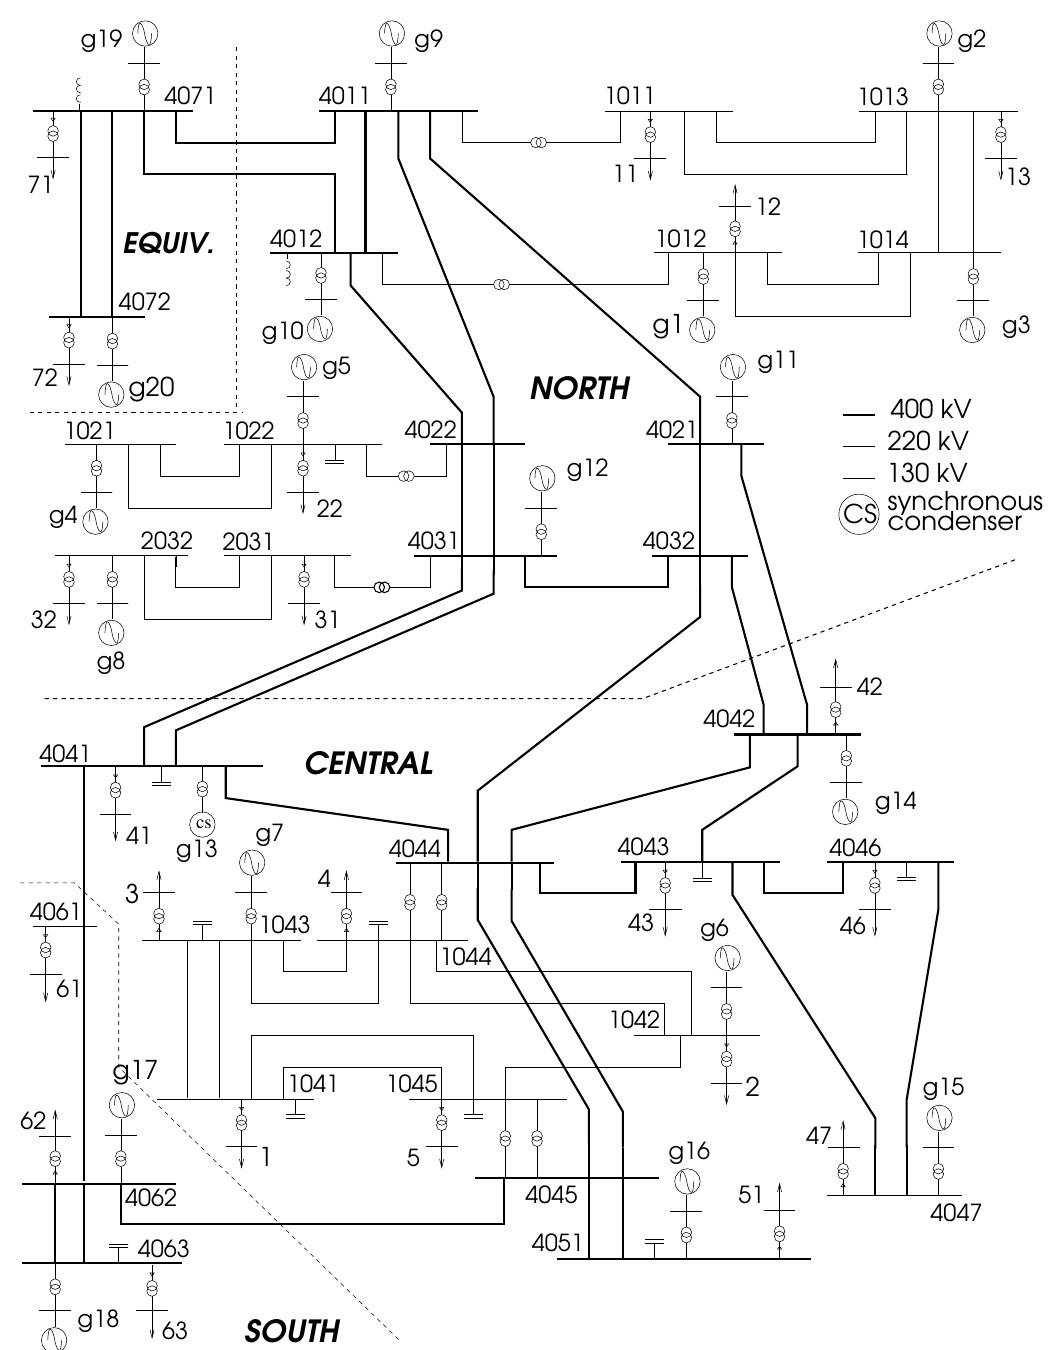
Dynamic Models
Section titled “Dynamic Models”Each generator is modeled as a detailed synchronous machine (SYNC_MACH) with:
- Machine model: Subtransient model with d- and q-axis dynamics (round-rotor or salient-pole depending on unit type)
- Excitation system:
EXC GENERIC1. a generic AVR with field current limiter, OEL, and optional PSS (SPEEDIN type) - Governor/turbine:
- Hydro units (g1–g5, g8–g12, g19–g20):
TOR HYDRO_GENERIC1, hydraulic turbine with governor - Thermal units (g6–g7, g13–g18):
TOR CONSTANT: constant mechanical torque
- Hydro units (g1–g5, g8–g12, g19–g20):
Loads are represented using the INJEC vfd_load model (variable-frequency-dependent exponential recovery load) with voltage-dependent active and reactive power characteristics.
Under-load tap changers are modeled with DCTL LTC2 discrete controllers on all distribution transformers.
Operating Points
Section titled “Operating Points”The repository provides two main operating points plus a family of load-increase variants:
| File | Description |
|---|---|
lf_A.dat / dyn_A.dat / volt_rat_A.dat | Operating Point A, base case, moderately stressed |
lf_B.dat / dyn_B.dat / volt_rat_B.dat | Operating Point B, heavily stressed, closer to voltage collapse |
lf_B_plus_*.dat / volt_rat_B_plus*.dat | Operating Point B with total load increased by 25 to 500 MW |
Operating Point B is the primary case for voltage stability studies; it features higher load levels in the central area and reduced reactive power reserves. The B_plus variants (documented in doc/variants.pdf) progressively stress the system further and are useful for tracing the loadability limit.
Repository Contents
Section titled “Repository Contents”| Path | Description |
|---|---|
lf_*.dat / dyn_*.dat / volt_rat_*.dat | Load-flow data, dynamic data, and power-flow solutions for all operating points |
settings1.dat | Solver configuration (time step, tolerances, threading) |
obs.dat | Observation file, monitors all buses, branches, machines, injectors |
uvls.dat | Undervoltage load-shedding (UVLS) controllers |
nothing.dst | Empty disturbance file (undisturbed simulation) |
trip_gen.dst / trip_branch.dst | Generator and branch trip disturbance scenarios |
short_trip_branch.dst | Short-circuit followed by branch trip (_changeLTCs variant modifies tap-changer behavior) |
eigen.dst / dampJac.dst | Jacobian export runs for eigenanalysis |
cmd.txt / sim_*.cfg | RAMSES command file and STEPSS GUI simulation configurations (sim_nothing, sim_trip, sim_short_trip) |
doc/ | Detailed system report (Nordic_test_system_V6.pdf) and operating-point variants description (variants.pdf) |
jupyterhub-tutorial/ | Self-contained tutorial with Execute.ipynb, a step-by-step voltage collapse notebook |
Disturbance Scenarios
Section titled “Disturbance Scenarios”Generator Trip (trip_gen.dst)
Section titled “Generator Trip (trip_gen.dst)”Trips generator g2 at s and observes the long-term system response:
0.000 CONTINUE SOLVER BD 0.020 0.001 0.0 ABL1.000 BREAKER SYNC_MACH g2 0100.000 STOPShort-Circuit with Branch Trip (short_trip_branch.dst)
Section titled “Short-Circuit with Branch Trip (short_trip_branch.dst)”Applies a three-phase fault on bus 4032 at s, cleared after 100 ms by tripping the faulted branch:
0.000 CONTINUE SOLVER BD 0.020 0.001 0.00 ABL1.000 FAULT BUS 4032 0. 0.1.100 CLEAR BUS 40321.100 BREAKER BRANCH 4032-4044 0 0200.000 STOPThe jupyterhub-tutorial/ folder contains its own variants of these scenarios (e.g. with shunt compensation switching) used by the tutorial notebook.
Quick Start
Section titled “Quick Start”Prerequisites
Section titled “Prerequisites”- Python 3 with stepss installed
- JupyterLab (recommended) or any Python environment
Install stepss following the installation guide.
Running a Simulation
Section titled “Running a Simulation”-
Clone the repository:
Terminal window git clone https://github.com/SPS-L/stepss-IEEE-Nordic-Test-system.gitcd stepss-IEEE-Nordic-Test-system -
Open
jupyterhub-tutorial/Execute.ipynbin Jupyter and run cells sequentially, or use the following Python script from the repository root:
import stepss
case = stepss.cfg()case.addData("dyn_B.dat")case.addData("volt_rat_B.dat")case.addData("settings1.dat")case.addObs("obs.dat")case.addDst("trip_gen.dst")
ram = stepss.sim()ram.execSim(case, 150.0)
# Extract and plot resultsext = stepss.extractor(case.getTrj())
Open Execute.ipynb directly. It contains a complete guided tutorial with inline plots for:
- Bus voltage evolution
- Generator frequency deviations
- Governor valve output and mechanical power
- Active and reactive power output
What to Observe
Section titled “What to Observe”After a generator trip on Operating Point B, the simulation demonstrates:
- Frequency transient: immediate frequency drop followed by primary governor response from hydro units
- Voltage dynamics: progressive voltage decline in the central area as load restoration (tap changers, thermostatic loads) increases demand beyond available reactive reserves
- Long-term voltage instability: if the system lacks sufficient reactive support, voltages collapse over tens of seconds. a classic long-term voltage stability phenomenon
License
Section titled “License”The stepss-IEEE-Nordic-Test-system repository is licensed under the Apache License 2.0. The IEEE PES-TR19 report itself is not redistributed; obtain it from the IEEE Resource Center link below.
References
Section titled “References”- IEEE PES Task Force on Test Systems for Voltage Stability Analysis and Security Assessment (chaired by T. Van Cutsem), “Test Systems for Voltage Stability Analysis and Security Assessment,” IEEE PES Technical Report PES-TR19, Aug. 2015. Available from the IEEE Resource Center
- STEPSS project page at the Sustainable Power Systems Lab
See Also
Section titled “See Also”- Python API Examples, Complete Python simulation workflow with this test system
- Python API Reference, Full API documentation for scripting simulations