

Loads and Equivalents
Injector models for loads (exponential, restorative, constant power, variable frequency drive) and for a Thévenin equivalent of an external system.
The INJEC record these models are entered with, and the rules on model names, are on the Injector Models page.
LOAD (inj_load): Exponential Recovery Load
Section titled “LOAD (inj_load): Exponential Recovery Load”Description
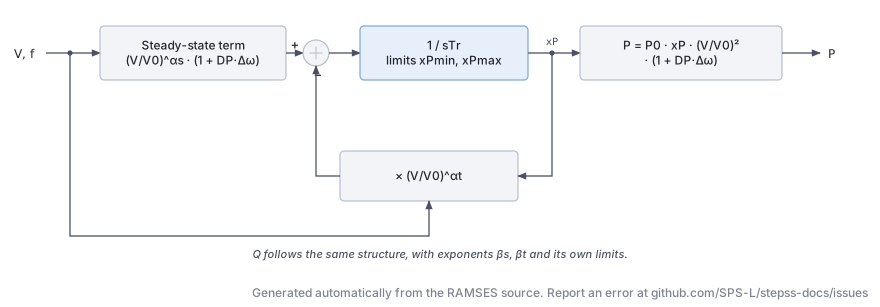
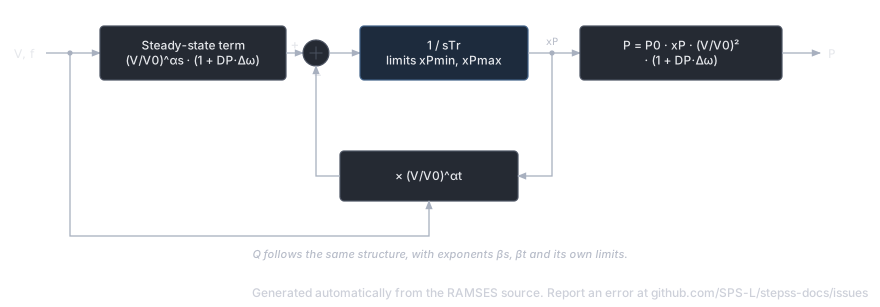
Section titled “Description”The exponential recovery load model captures the transient and steady-state voltage and frequency dependency of aggregated loads. Immediately after a voltage disturbance, the load behaves according to a transient voltage exponent; it then recovers exponentially to a steady-state behaviour described by a different exponent. The model supports separate active () and reactive () power recovery dynamics, each with individual minimum/maximum limiters on the recovery variable.
Scientific Description
Section titled “Scientific Description”The model is parameterized in terms of initial active and reactive conductance/susceptance, and . Two recovery state variables and evolve according to:
where is the per-unit speed deviation, is the bus voltage magnitude, is the initial voltage, are transient exponents, are steady-state exponents, and is the load recovery time constant. The injected currents are then:
When the recovery variable hits its limit (due to e.g. Stalling or complete voltage collapse), the limit is held until the direction of the derivative reverses.
Parameters
Section titled “Parameters”| # | Name | Description | Unit |
|---|---|---|---|
| 1 | DP | Frequency sensitivity of active power | pu/pu |
| 2 | A1 | Proportion of type-1 component in | |
| 3 | alpha1 | Transient voltage exponent for (type 1) | |
| 4 | A2 | Proportion of type-2 component in | |
| 5 | alpha2 | Transient voltage exponent for (type 2) | |
| 6 | alpha3 | Transient voltage exponent for (type 3, proportion ) | |
| 7 | DQ | Frequency sensitivity of reactive power | pu/pu |
| 8 | B1 | Proportion of type-1 component in | |
| 9 | beta1 | Transient voltage exponent for (type 1) | |
| 10 | B2 | Proportion of type-2 component in | |
| 11 | beta2 | Transient voltage exponent for (type 2) | |
| 12 | beta3 | Transient voltage exponent for (type 3) |
Internal computed parameters include the steady-state exponents for each component (derived from the transient exponents), initial conductance , susceptance , and initial voltage .
State Variables
Section titled “State Variables”| Variable | Description |
|---|---|
iy | -component of injected current (pu on system base) |
ix | -component of injected current (pu on system base) |
xp | Active power recovery variable (dimensionless) |
xq | Reactive power recovery variable (dimensionless) |
Observables: P, Q, xp, xq
Usage Example
Section titled “Usage Example”Show the data record
INJEC LOAD LOAD1 BUS1 # FP FQ P Q: share of the power-flow injection (FP, FQ) or initial power (P in MW, Q in Mvar) 1. 1. 0. 0. # DP: Frequency sensitivity of active power (pu/pu) 1.5 # A1: Proportion of type-1 component in P 0.3 # alpha1: Voltage exponent of the A1 term of P 1.0 # A2: Proportion of type-2 component in P 0.2 # alpha2: Voltage exponent of the A2 term of P 2.0 # alpha3: Voltage exponent of the remaining (1-A1-A2) term of P 0.5 # DQ: Frequency sensitivity of reactive power (pu/pu) 1.8 # B1: Proportion of type-1 component in Q 0.4 # beta1: Voltage exponent of the B1 term of Q 2.5 # B2: Proportion of type-2 component in Q 0.1 # beta2: Voltage exponent of the B2 term of Q 3.0 # beta3: Voltage exponent of the remaining (1-B1-B2) term of Q 2.0;vfd_load (inj_vfd_load): Variable Frequency Drive Load
Section titled “vfd_load (inj_vfd_load): Variable Frequency Drive Load”Description
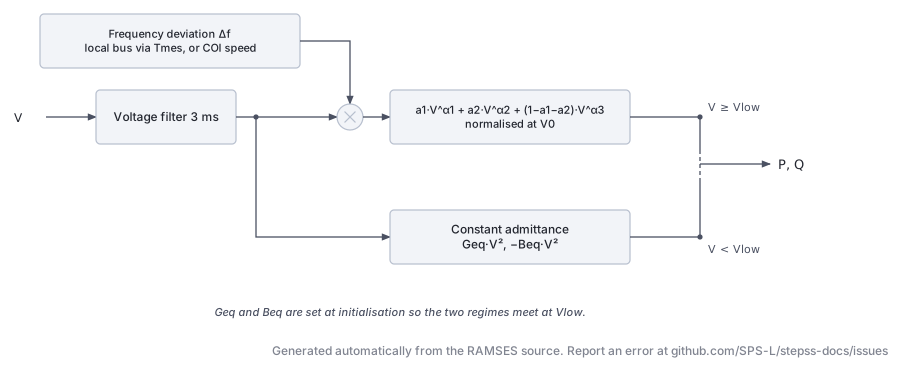
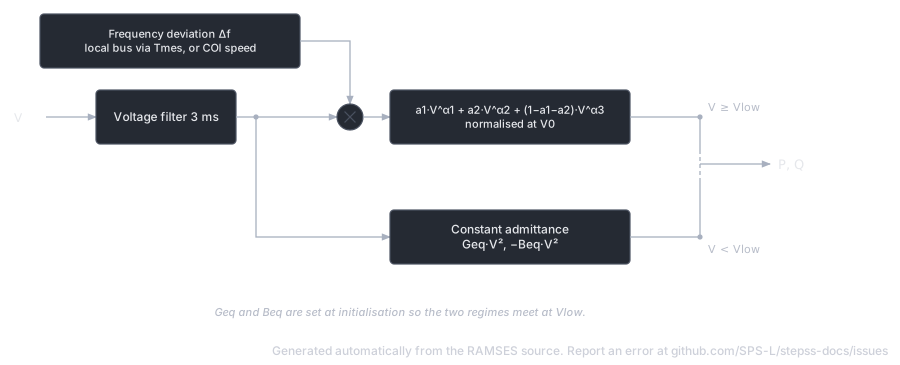
Section titled “Description”The VFD load model represents aggregate industrial loads driven by variable-frequency drives, where the power consumption exhibits a composite voltage-dependent characteristic with multiple exponential components and frequency sensitivity. It also includes low-voltage protection: below a configurable threshold , the load switches to a constant-admittance representation, preventing numerical difficulties during deep voltage sags.
Scientific Description
Section titled “Scientific Description”The active and reactive powers depend on bus voltage and frequency deviation :
Below , an equivalent constant admittance is used:
where and are computed at initialization to ensure continuity at . The switch between the two regimes is governed by a piecewise-linear function of :
A small voltage filter (time constant 0.003 s) smooths the transition. The frequency deviation can optionally be computed from the local bus frequency (measured via an f_inj block with time constant ) or from the system centre-of-inertia speed.
The initial voltage can differ from the transmission bus voltage if a distribution transformer ratio is implied (set to specify the distribution-side voltage; otherwise the transmission voltage is used directly).
Parameters
Section titled “Parameters”| # | Name | Description | Unit |
|---|---|---|---|
| 1 | Dp | Frequency sensitivity of active power | pu/pu |
| 2 | a1 | Fraction of type-1 component in | |
| 3 | alpha1 | Voltage exponent of type-1 component | |
| 4 | a2 | Fraction of type-2 component in | |
| 5 | alpha2 | Voltage exponent of type-2 component | |
| 6 | alpha3 | Voltage exponent of type-3 component (fraction ) | |
| 7 | Dq | Frequency sensitivity of reactive power | pu/pu |
| 8 | b1 | Fraction of type-1 component in | |
| 9 | beta1 | Voltage exponent of type-1 component | |
| 10 | b2 | Fraction of type-2 component in | |
| 11 | beta2 | Voltage exponent of type-2 component | |
| 12 | beta3 | Voltage exponent of type-3 component | |
| 13 | Vinit | Initial distribution-bus voltage (0 = use transmission voltage) | pu |
| 14 | Vlow | Voltage threshold for constant-admittance regime (recommended 0.5–0.7) | pu |
| 15 | foption | 1 = use local bus frequency; 0 = use COI speed | flag |
| 16 | Tmes | Frequency measurement time constant | s |
State Variables
Section titled “State Variables”| Variable | Description |
|---|---|
Vreal | Voltage at equivalent distribution bus |
V | Filtered distribution-bus voltage (3 ms filter) |
P | Active power consumed |
Q | Reactive power consumed |
fbus | Local bus frequency (used if foption=1) |
df | Frequency deviation |
u | Regime switch (1 = above , 0 = constant admittance) |
Observables: P, Q, df, u
Usage Example
Section titled “Usage Example”Show the data record
INJEC vfd_load VFD1 BUS_IND # FP FQ P Q: share of the power-flow injection (FP, FQ) or initial power (P in MW, Q in Mvar) 1. 1. 0. 0. # Dp: Frequency sensitivity of active power (pu/pu) 1.5 # a1: Fraction of type-1 component in P 0.7 # alpha1: Voltage exponent of type-1 P component 2.0 # a2: Fraction of type-2 component in P 0.2 # alpha2: Voltage exponent of type-2 P component 1.0 # alpha3: Voltage exponent of type-3 P component 0.5 # Dq: Frequency sensitivity of reactive power (pu/pu) 1.2 # b1: Fraction of type-1 component in Q 0.5 # beta1: Voltage exponent of type-1 Q component 2.5 # b2: Fraction of type-2 component in Q 0.1 # beta2: Voltage exponent of type-2 Q component 1.5 # beta3: Voltage exponent of type-3 Q component 0.8 # Vinit: Initial distribution-bus voltage (0 = use transmission voltage) (pu) 0.0 # Vlow: Voltage threshold for constant-admittance regime (recommended 0.5–0.7) (pu) 0.6 # foption: 1 = use local bus frequency; 0 = use COI speed (flag) 0 # Tmes: Frequency measurement time constant (s) 0.1;RESTLD (inj_restld): Restorative Load
Section titled “RESTLD (inj_restld): Restorative Load”Description
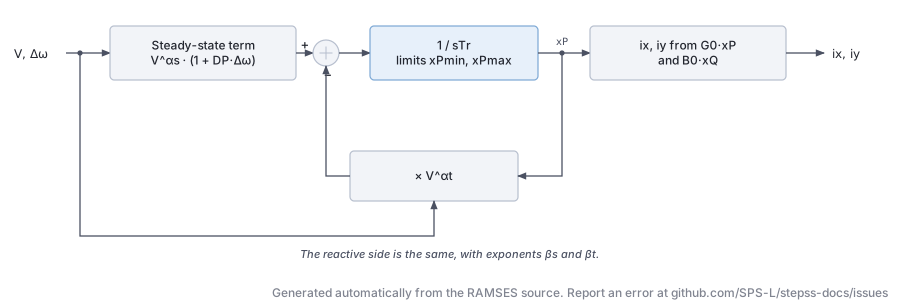
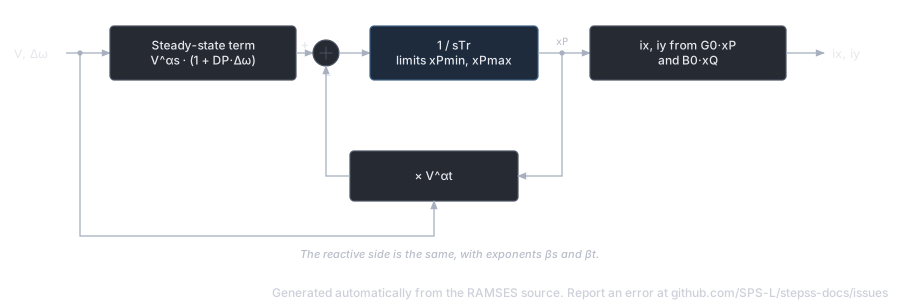
Section titled “Description”The restorative load model represents loads that self-restore toward a nominal characteristic after a voltage disturbance. The load’s active and reactive powers are governed by two internal recovery variables that evolve dynamically, allowing the simulation to capture the slow restoration of thermostatically controlled loads (heating, cooling) and similar self-restoring demand.
Scientific Description
Section titled “Scientific Description”The recovery variable for active power satisfies:
with analogous equation for . Here and are the steady-state and transient voltage exponents respectively. Limiters are applied. The injected currents are expressed as:
where the ratio governs the voltage dependence through vrat.
Parameters
Section titled “Parameters”| # | Name | Description | Unit |
|---|---|---|---|
| 1 | DP | Frequency sensitivity of active power | pu/pu |
| 2 | alphat | Transient active power voltage exponent | |
| 3 | alphas | Steady-state active power voltage exponent | |
| 4 | xP_min | Minimum limit for | |
| 5 | xP_max | Maximum limit for | |
| 6 | DQ | Frequency sensitivity of reactive power | pu/pu |
| 7 | betat | Transient reactive power voltage exponent | |
| 8 | betas | Steady-state reactive power voltage exponent | |
| 9 | xQ_min | Minimum limit for | |
| 10 | xQ_max | Maximum limit for | |
| 11 | Tr | Load recovery time constant | s |
State Variables
Section titled “State Variables”| Variable | Description |
|---|---|
iy | -component of injected current |
ix | -component of injected current |
xp | Active power recovery variable |
xq | Reactive power recovery variable |
Observables: P, Q, xp, xq
Usage Example
Section titled “Usage Example”Show the data record
INJEC RESTLD RESTLD1 BUS2 # FP FQ P Q: share of the power-flow injection (FP, FQ) or initial power (P in MW, Q in Mvar) 1. 1. 0. 0. # DP: Frequency sensitivity of active power (pu/pu) 1.5 # alphat: Active power exponent multiplying xP in the recovery equation 2.0 # alphas: Active power steady-state exponent in the recovery equation 0.0 # xP_min: Lower limit of active power recovery state xP 0.0 # xP_max: Upper limit of active power recovery state xP 2.0 # DQ: Frequency sensitivity of reactive power (pu/pu) 1.2 # betat: Reactive power exponent multiplying xQ in the recovery equation 2.0 # betas: Reactive power steady-state exponent in the recovery equation 0.0 # xQ_min: Lower limit of reactive power recovery state xQ 0.0 # xQ_max: Upper limit of reactive power recovery state xQ 2.0 # Tr: Load recovery time constant (s) 60.0;PQ (inj_PQ): Constant PQ Load
Section titled “PQ (inj_PQ): Constant PQ Load”Description
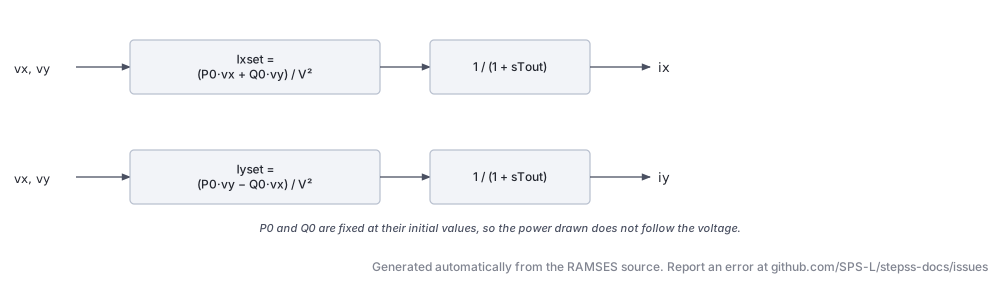
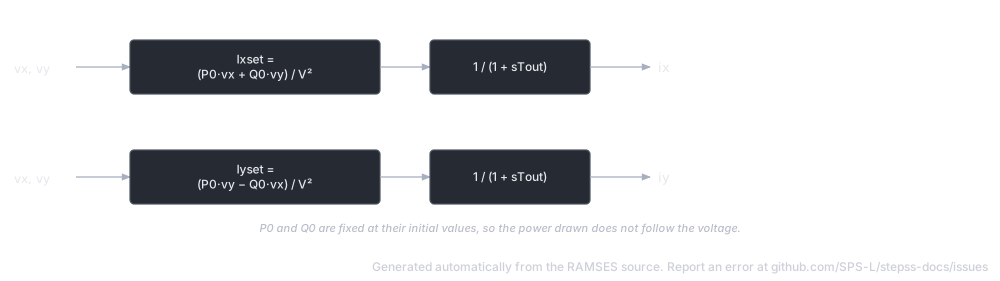
Section titled “Description”The simplest injector model: maintains constant active and reactive power consumption regardless of bus voltage or frequency. The power is fixed at its initial operating-point value. A small first-order filter (time constant Tout) drives the injected currents smoothly to their target values, preventing algebraic loops.
Scientific Description
Section titled “Scientific Description”The current references are set to deliver the initial powers and at the measured voltage :
These references pass through a first-order filter with time constant to produce the actual injected currents:
Parameters
Section titled “Parameters”| # | Name | Description | Unit |
|---|---|---|---|
| 1 | Tout | Output filter time constant (recommended: 0.01 s) | s |
Initial conditions , , are computed automatically at initialization.
State Variables
Section titled “State Variables”| Variable | Description |
|---|---|
ix | Injected -current |
iy | Injected -current |
Ixset | Current reference |
Iyset | Current reference |
P | Observed active power |
Q | Observed reactive power |
V | Bus voltage magnitude |
Observables: P, Q
Usage Example
Section titled “Usage Example”Show the data record
INJEC inj_PQ LOAD_PQ BUS3 # FP FQ P Q: share of the power-flow injection (FP, FQ) or initial power (P in MW, Q in Mvar) 1. 1. 0. 0. # Tout: Output filter time constant (recommended: 0.01 s) (s) 0.01;THEVEQ (inj_theveq): Thévenin Equivalent
Section titled “THEVEQ (inj_theveq): Thévenin Equivalent”Description
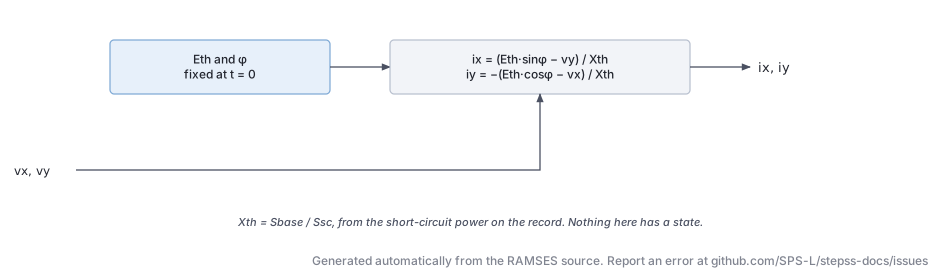
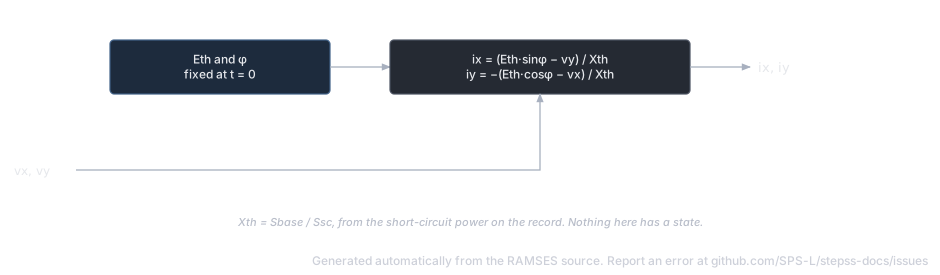
Section titled “Description”Models an external network or generator cluster as a Thévenin equivalent: an ideal voltage source behind a pure reactance . The model computes the internal voltage magnitude and phase angle at initialization from the initial bus conditions and holds them constant during the simulation. It is useful for representing neighbouring system equivalents or simplified machine representations.
Scientific Description
Section titled “Scientific Description”The Thévenin reactance is obtained from the specified short-circuit power (MVA):
The internal voltage phasor is computed at :
During simulation the injected currents satisfy:
Parameters
Section titled “Parameters”| # | Name | Description | Unit |
|---|---|---|---|
| 1 | XTH | Short-circuit power of the equivalent (converted to at initialization) | MVA |
Internal parameters ETH (Thévenin voltage magnitude, pu) and phase (internal angle, rad) are computed automatically.
State Variables
Section titled “State Variables”| Variable | Description |
|---|---|
iy | Injected -current |
ix | Injected -current |
Observables: P, Q (in MW and Mvar at system base)
Usage Example
Section titled “Usage Example”Show the data record
INJEC THEVEQ EQUIV1 SLACK_BUS # FP FQ P Q: share of the power-flow injection (FP, FQ) or initial power (P in MW, Q in Mvar) 1. 1. 0. 0. # XTH: Short-circuit power of the equivalent (MVA) 2000.0;